Theoretical background
Isotopologues in mass spectrometry
Depending on their isotopic composition, peptides have different isotopologues.
Element |
Isotope |
Relative abundance (%) |
|---|---|---|
Hydrogen |
H[1] |
99.9885 |
Hydrogen |
H[2] |
0.0115 |
Carbon |
C[12] |
98.93 |
Carbon |
C[13] |
1.07 |
Nitrogen |
N[14] |
99.632 |
Nitrogen |
N[15] |
0.368 |
Oxygen |
O[16] |
99.757 |
Oxygen |
O[17] |
0.038 |
Oxygen |
O[18] |
0.205 |
Sulfur |
S[32] |
94.93 |
Sulfur |
S[33] |
0.76 |
Sulfur |
S[34] |
4.29 |
Stable isotopes of most common organic elements in peptides, values are taken from MIDAs[1]
The first isotopologue (noted M0) contains peptides which elements are composed of only the lightest stable isotopes. In contrast the second isotopologue (M1) has one of its element with a supplementary neutron. Isotopologues follow notation Mn where n is the number of supplementary neutrons in the chemical formula compared to M0.
e.g: the chemical formula of Glycine is “C2H5O2N1”, the different isotopic compositions for isotopologues M0 and M1 are described in the table below
Isotopologue |
Carbon |
Hydrogen |
Oxygen |
Nitrogen |
|---|---|---|---|---|
M0 |
C[12]*2 |
H[1]*5 |
O[16]*2 |
N[14]*1 |
M1 |
C[12]*1, C[13]*1 |
H[1]*5 |
O[16]*2 |
N[14]*1 |
M1 |
C[12]*2 |
H[1]*4, H[2]*1 |
O[16]*2 |
N[14]*1 |
M1 |
C[12]*2 |
H[1]*5 |
O[16]*1, O[17]*1 |
N[14]*1 |
M1 |
C[12]*2 |
H[1]*5 |
O[16]*2 |
N[15]*1 |
Composition of M0 and M1 of Glycine
M0 can only have one composition, meanwhile there are multiple combinations for M1, each with one of its elements swapped with a heavier isotope. The complexity of formulas increases even more with further isotopologues.
In high-resolution mass spectrometry, the mass spectrometer
is able to differentiate peaks of isotopologues.
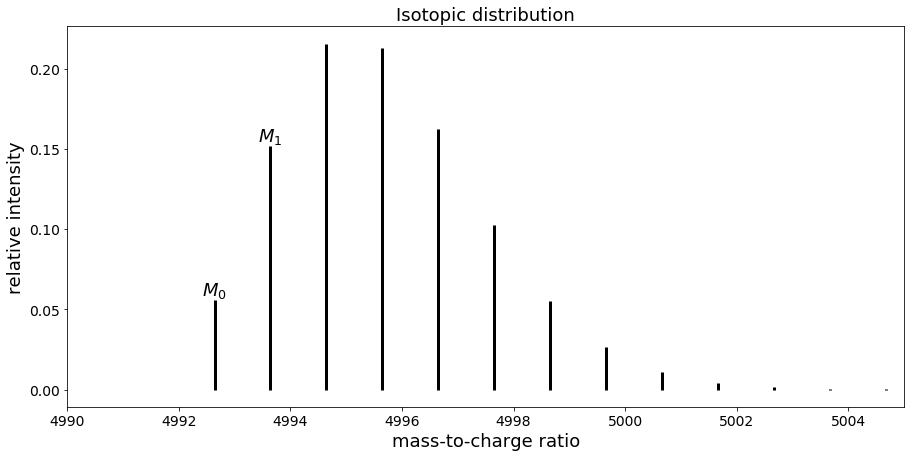 Mass spectrum of peptide with sequence “VGEVFINYIQRQNELFQGKLAYLIIDTCLSIVRPNDSKPLDNR”
In that case, the first peak corresponds to M0 while the second one is M1, the third one M2 etc.
Computation of isotopologue intensity
Isotopologue intensity can be computed analytically.
Formulas are adapted from an article by Wang, Benlian et al.[2].
We consider a peptide of formula
where n(C), n(H), n(O), n(N) and n(S) denote the number of atoms of carbon, hydrogen, oxygen, nitrogen and sulfur respectively.
Compute M0 intensity
For such peptide, the normalized intensity of the monoisotopic ion is given by:
where a(isotope) is the relative abundance of the isotope.
Compute M1 intensity
Following a polynomial expansion, intensity of the second isotopologue M1 is:
We can observe that formulas follow a combinatorial explosion.
Quantify proteins with C[12] enrichment
Simple Light Isotopic Metabolic Labeling (SLIM-labeling)[3] is a method developed by Léger et al. that allows quantification of proteins via C[12] enrichment.
Cells are provided with a growth media containing glucose enriched with C[12] at 99.99 % as the only carbon source, the glucose is then assimilated by the cell to synthetize proteins which carbons have a C[12] abundance of 99.99 % instead of 98.93 %.
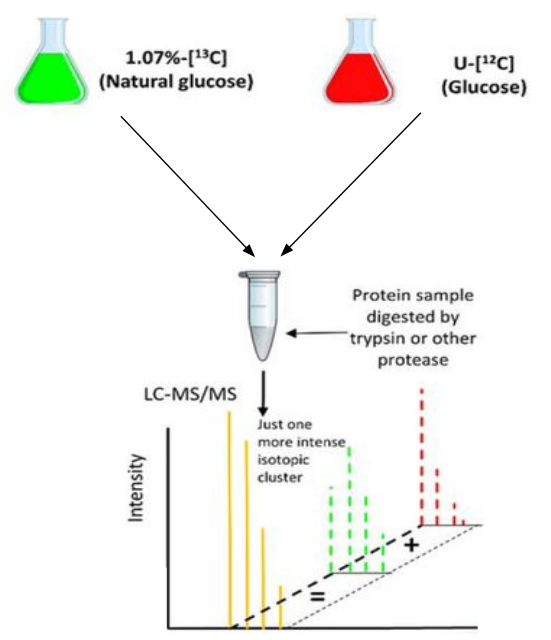
Usage of SLIM-labeling by combining two experimental conditions
SLIM-labeling allows the combination of proteins obtained in two different experimental conditions (Natural Carbon/Normal Condition NC and 99.99 % C[12] enrichment 12C) in a single mass spectrometry run.
By comparing experimental and theoretical intensities of adjacent isotopologues (in our case M0 and M1), we are able to get the ratio of proteins between both conditions.
Another advantage of SLIM-labeling is that it increases the intensity of the first isotopologue, making it easier to detect.
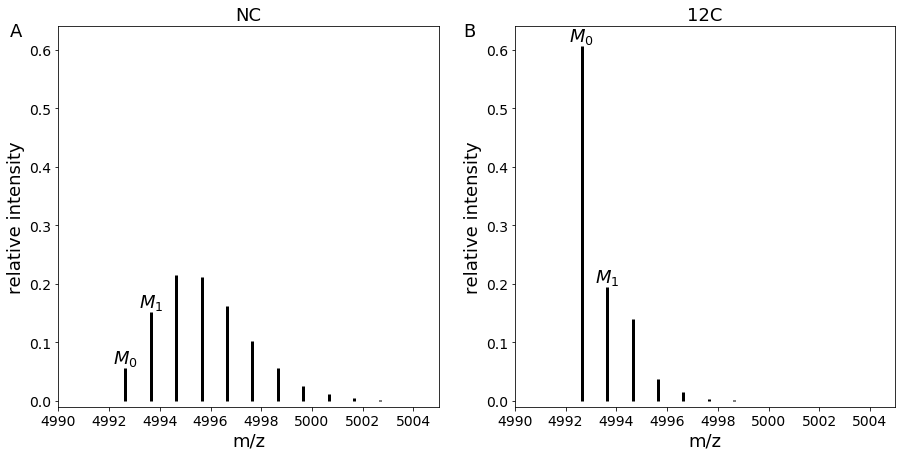 Comparison of mass spectra in NC and 12C conditions for peptide with sequence “VGEVFINYIQRQNELFQGKLAYLIIDTCLSIVRPNDSKPLDNR”
Strategy to take into account auxotrophies
A limitation of SLIM-labeling is that some organisms can have auxotrophies to amino acids, hence they cannot synthetize those for protein production. In this case, they need to be provided with essential amino acids.
The problem is that 99.99 % C[12] enriched amino acids are not available nor are produced (as of 2019) thus those essential amino acids will keep natural carbon abundance (with 98.93 % C[12] and 1.07 % C[13]). Therefore, the formulas shown above become incorrect for SLIM-labeling (as abundances vary depending on wether the amino acid is labelled or not).
Seq-to-first-iso implements an algorithm that takes into account labelled and unlabelled amino acids for M0 and M1 computation.
To do so, we defined X as a virtual chemical element with 2 isotopes with abundance of natural carbon. X can then be substituted to the carbon of unlabelled amino acids to compute correct isotopologue intensities.
New formulas were developed to take this new element into account:
and
References
[1]: Alves, Gelio et al. “Molecular Isotopic Distribution Analysis (MIDAs) with adjustable mass accuracy.” Journal of the American Society for Mass Spectrometry vol. 25,1 (2014): 57-70. doi:10.1007/s13361-013-0733-7
[2]: Wang, Benlian et al. “Isotopologue distributions of peptide product ions by tandem mass spectrometry: quantitation of low levels of deuterium incorporation.” Analytical biochemistry vol. 367,1 (2007): 40-8. doi:10.1016/j.ab.2007.03.036
[3]: Léger, Thibaut et al. “A Simple Light Isotope Metabolic Labeling (SLIM-labeling) Strategy: A Powerful Tool to Address the Dynamics of Proteome Variations In Vivo.” Molecular & cellular proteomics : MCP vol. 16,11 (2017): 2017-2031. doi:10.1074/mcp.M117.066936